The 3 best root cause analysis tools: a guide for decision making

Conteúdo
Results management has become an increasingly powerful tool for aligning teams around a common goal.
Clarifying goals and, above all, the means to achieve results is paramount to keeping a team cohesive and integrated.
There are, however, tools that make root cause problem solving even more powerful, allowing greater visibility and clarity in tracking targets and indicators.
In this post, we have selected some problem analysis tools, decision diagrams, and other ways to do root cause investigation.
Read carefully and you will see which known problem-solving tools, such as the 5 why’s method, Ishikawa’s graph (fishbone or cause-and-effect analysis), and Pareto analysis, among other concepts are excellent ways of identifying the root cause of a problem.
Introduction to Root Cause Problem Solving
Many of these root cause analysis tools come from the concept of Quality Management, which has emerged to ensure quality and standard manufacturing processes.
To this end, a series of root cause analysis tools and methods have been created to ensure that product manufacturing maintains the quality standard perceived by the market.
Most of these methodologies are based on the concept of continuous improvement.
This set of activities is summarized by the acronym PDCA (acronym for Plan, Do, Check, Act).
Learn more on our blog: Improve your management right away: learn how to do PDCA step by step
The evolution of these root cause analysis tools has made them increasingly branch out from plants and factories to reach commercial offices, integrating the most used group of management tools.
Concepts and tools for cause-and-effect analysis or root cause analysis of problems, for example, previously used only on production lines, have become routine with managers in all areas of companies.
The practical and problem-solving approach allows the adoption of these methodologies to greatly benefit top management, especially because of their objectivity and ease of follow-up, especially when combined with decision-making tools.
In practical terms, the Root Cause Analysis process can be defined, in a general scope, as:
- define the problem;
- identify possible causes;
- verify the real causes;
- propose a solution to the problem;
- deploy the solution;
- analyze the results.
In the context of upper management, the analysis of causes and effects is generally applied to deviations from goals, to identify the main factors that led to the failure of that period.
Thus, when dealing with the causes of a deviation, managers try to keep the goal close to the value to be reached and, therefore, in line with the expectations of the company.
There are several Problem Root Cause Analysis tools, however, each with its own particularities.
It is up to each team to define which of the best problem analysis tools to apply within their respective realities.
Here we will delve into 3 main ways of doing root cause investigation:
- Pareto chart;
- Fishbone – Ishikawa diagram research methodology;
- 5 Why’s research method.
1- Root cause analysis – Pareto
The Pareto diagram is a practical example of a tool that allows you to identify and select items that are responsible for greatly effecting process improvement, keep reading:
80% of the results are caused by 20% of the factors.
This is the concept of Pareto analysis: 80/20
From a method viewpoint for identifying problems, it can be stated that 80% of problems can be solved by treating 20% of the causes.
Thus, for the creation of a Pareto Diagram we must:
- Identify a goal that was not reached in a given period;
- Raise the possible problems that led to the deviation from the goal;
- Assign the frequency with which they appear or the degree of relevance;
- Sort the data in descending order according to frequency | importance;
- Calculate the percentage referring to each item, and create a new column with the cumulative percentage of the series;
- Create a graph where the columns represent the frequency and the rows are the cumulative percentages;
- Select the problems that, after adding the percentages, represent 80% of the factors.
2- Root cause analysis – Fishbone
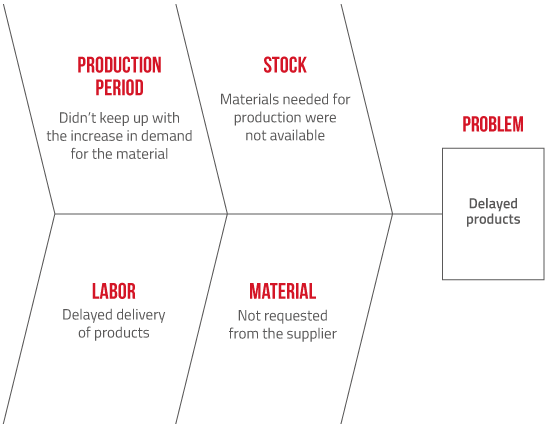
The fishbone diagram, also known as the Cause and Effect diagram and the Ishikawa diagram, is a graphical tool used to map the root causes of a problem.
Due to its hierarchical form, it allows you to group and visualize several causes that are considered as the origin of a problem or of an improvement opportunity that you wish to achieve, besides its effects on the problem or result.
In its structure of cause and effect analysis to identify the root cause of the problem, the construction of the Ishikawa diagram follows the following steps:
- Choose the problem you want to analyze;
- Consider information regarding the problem;
- Brainstorm the problem, together with a team, listing possible causes, both primary and secondary;
- Identify the causes most pertinent to the problem and group them according to the 6M’s;
- Propose solutions to the causes raised, always have a person responsible to implement the solution.
Another important detail in root cause problem solving using the Ishikawa diagram is to use it as a method to identify the 6 problems categories defined by Ishikawa, known as the 6Ms:
- Method: How does the work being done affect the problem?
- Machine: How does the equipment used in the process influence the problem?
- Measure: How do the metrics used to measure activity development influence the problem?
- Environment: How does the environment in which the activity is being developed influence the problem?
- Material: How does the quality and type of materials used influence the problem?
- Labor: How do the people involved in the activity influence the problem?
Remember: these are just some of the possibilities of categories to be analyzed with the help of the Ishikawa diagram.
By using the fishbone research methodology in the quest for quality processes, you must define your own concepts, based on the specifics of your business.
Learn more about this root cause analysis tool in this blog post: What is an Ishikawa diagram and how do you make one?
3- Root cause analysis – 5 whys
The 5 whys quality tool is very simple, but no less efficient.
It starts from the principle of digging deep into an issue, trying to extract the root cause of the deeper problem.
It is widely used when a company wants to improve the quality of its deliveries and to move on to the continuous improvement of its processes.
It was created by Taiichi Ohno, in the 50s. He worked at Toyota and realized the need to improve the quality of the company’s products to meet customer needs.
You execute this methodology by questioning why a certain problem happens, consecutively, five times.
After five questions, Ohno believed that you would be able to establish the real root cause of a problem, and that steps could be taken to eliminate it and create a process that would guarantee the quality of deliveries.
The application of the 5 whys quality tool is especially suitable for problems with a few variables.
When problems become more complex, analyzes of various other factors become necessary, and this method is not sufficient to identify problems.
Advantages of Using Root Cause Analysis Tools
Finally, we have grouped together some of the most commonly used root cause analysis tools in management processes.
The biggest benefits root cause analysis can bring into your business are:
- Alignment: after the impediments to achieving results are open for discussion to the entire team;
- Depth: because analysis is not done superficially, the probability a team can focus on the real cause is greater;
- Standardization: so all analyzes follow the same method of execution and aim to reach the root cause of any processes not achieving their goals.
But once you discover the problems and analyze their root causes, how do you prioritize which ones will be solved first?
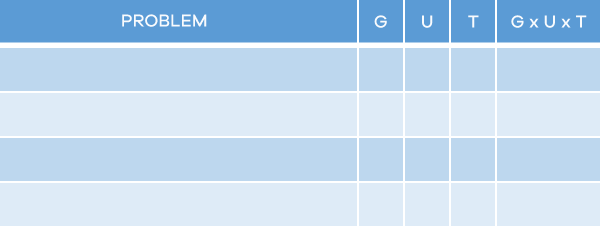
For this, we suggest an extra tool, the decision prioritization matrix, or decision diagram, known as the GUT matrix.
It is very simple and easy to use and should be used whenever you have many problems to solve and do not know which one to start with.
The matrix created by Charles Kepner and Benjamin Tregoe in 1981 is still quite useful and works as follows:
You should use the table below to give a grade for each problem, from zero to five, referring to 3 criteria:
- Gravity of the problem;
- Urgency in solving it;
- Tendency for the problem to potentiate.
Understand each of the criteria in the decision-making diagram better:
- Gravity: For this concept, it is necessary to define how much the consequences of the problem will affect the achievement of the strategic objectives of the company, the security of the people and the community.
- Urgency: What will happen if the problem is not resolved immediately? Is it possible to wait, or will operations be paralyzed? Is there a contingency plan? Consider these factors to define the speed at which the problem should be solved.
- Tendency: What is the probability that the problem will get worse if it is not resolved soon? Does it appear as if it will hinder the operation of the company?
Based on these criteria, assign scores following this scale:
- It is not an urgent problem or serious, it does not cause immediate damage.
- A little urgent, a little serious and it will only get worse in the long run.
- Urgent and serious and will worsen in the medium term.
- Very urgent, it will get worse in a short time.
- Extremely urgent and serious. It needs to be fixed now before it gets worse.
Put the scores in the decision matrix, multiply the numbers and you will know that the highest result corresponds to the problem that must be solved first.
Now that you know so much about the best root cause analysis tools and how to prioritize the solutions, how about learning about software that encompasses several management and business management tools? Solve your business problems based on real data and focus on results!
Revolutionize the management of your company with STRATWs One


